As an investor, you may often see numbers that show how an investment has performed—but when that performance spans several years, it may get tricky to compare. That’s where CAGR, or Compound Annual Growth Rate, can offer clarity. It shows how much an investment might have grown each year if it had increased at a steady, compounded rate, smoothing out short-term ups and downs.
This article will explore CAGR, its definition, formula, and calculation. We’ll also explore its significance in investment analysis and provide examples to illustrate its practical application.
CAGR stands for Compound Annual Growth Rate and shows the average annual growth of an investment over time, assuming steady compounding.
It may help you compare long-term performance across different assets or timeframes.
While helpful, CAGR doesn’t show short-term volatility, risk levels, or cash flow impacts and assumes a constant growth rate.
There’s no fixed “good” CAGR. What’s considered strong growth depends on the investment type, time frame, and your financial goals.
You may want to use CAGR alongside other metrics to better understand long-term trends and performance.
What is CAGR?
CAGR stands for Compound Annual Growth Rate. It is a financial metric that measures an investment’s average annual growth rate over a specified period, assuming that the growth is compounded annually. This means that CAGR considers the compounding effect, where the returns from previous years are reinvested to generate returns in subsequent years.
CAGR is particularly useful for evaluating investments that span multiple years, as it provides a single rate of growth that reflects the investment’s overall performance. This can make it easier to compare the historical growth of different investments, even if they had different holding periods or experienced varying performances over time.
Let’s say your investment started at $10,000 and grew to $20,000 over five years. The CAGR tells you the constant rate at which that $10,000 would have needed to grow each year to reach $20,000 in year five—assuming the growth happened steadily.
CAGR formula
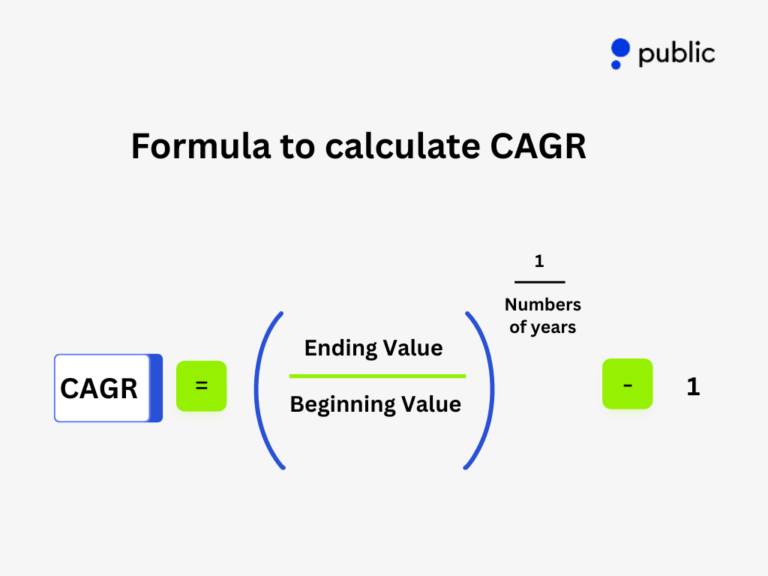
The formula to calculate CAGR is straightforward:
CAGR = (Ending Value / Beginning Value) ^ 1/numbers of years − 1
Where:
Beginning value is the initial value of your investment
Ending value is the value of the investment at the end of the period
Number of years is the duration of the investment period
You can express the result as a percentage by multiplying it by 100.
How to calculate CAGR?
To understand CAGR, let’s consider an example.
Suppose you invested $10,000 in a mutual fund five years ago; today, its value is $15,000. To calculate the CAGR, you would use the formula as follows:
CAGR = (10,000 / 15,000) ^ ⅕ – 1
This simplifies to:
CAGR = (1.5) ⅕ -1 ≈ 8.45%
This means that your investment grew at an average annual rate of approximately 8.45% over the five-year period.
How CAGR differs from average annual return
You might be wondering how CAGR compares to the average annual return. While they both deal with growth over time, they aren’t the same.
CAGR accounts for compounding and assumes the same growth rate each year.
Average annual return is the arithmetic mean of yearly returns, which doesn’t account for compounding or fluctuations.
CAGR gives you the true annual growth rate accounting for compounding, while the average return can overstate performance.
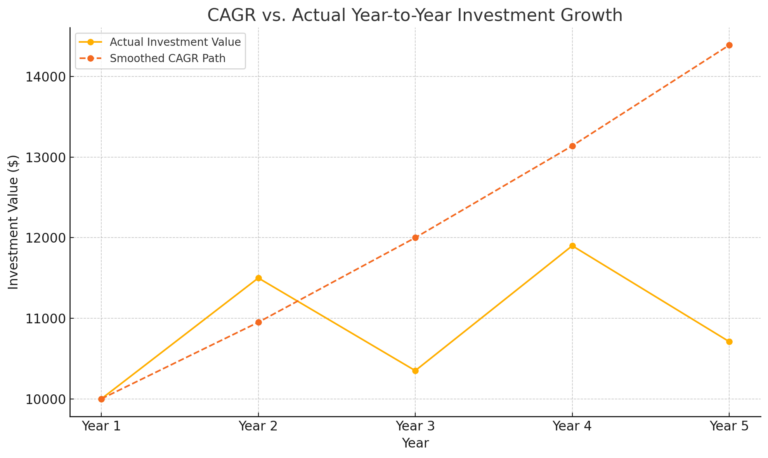
CAGR example chart: Smoothed vs. Actual growth
To help you visualize how CAGR works compared to real annual returns, here’s a simplified 5-year example:
Table: Year-by-Year comparison
Year
Actual value ($)
Annual change
Smoothed CAGR value ($)
Year 1
10,000
–
10,000
Year 2
11,500
0.15
10,950
Year 3
10,350
–10%
12,000
Year 4
11,900
0.15
13,140
Year 5
10,710
–10%
14,390
Chart: CAGR vs. Actual investment growth
The chart above shows how CAGR smooths the ups and downs of actual investment performance, offering a clearer view of average annual growth. While helpful for long-term comparison, it’s important to note that CAGR doesn’t reflect volatility.
Importance of CAGR in investment analysis
You may find CAGR helpful for several reasons:
1. Long-term performance evaluation: CAGR helps you see how an investment has grown over time by smoothing out year-to-year fluctuations. It gives you a consistent annual growth rate, which may help in a more straightforward analysis.
2. Comparison of investments: If you’re comparing different investments—especially ones with different durations—CAGR offers a way to evaluate them on an even playing field.
3. Reviewing historical trends: Looking at an investment’s past CAGR may give you insight into its long-term trend. However, it’s important to remember that past performance doesn’t predict or guarantee future results.
Potential limitations of CAGR
While CAGR may help you understand long-term growth, it’s useful to keep a few limitations in mind:
1. Assumes constant growth: CAGR assumes that the investment grows at a constant rate each year, which may not accurately reflect real-world fluctuations.
2. Does not account for cash flows: It does not consider the timing or amount of cash flows into or out of the investment, which can affect actual returns.
3. Not suitable for short-term investments: CAGR is most useful for evaluating investments over multiple years. For shorter periods, other metrics might be more appropriate.
What is a good CAGR?
There’s no single answer to what makes a “good” CAGR—it depends on the type of investment, your time horizon, and market conditions.
Savings accounts may have CAGRs below 2%, while stocks historically show higher rates over long periods.
To judge performance, you may compare an investment’s CAGR to relevant benchmarks like the S&P 500 or sector-specific indexes.
A higher CAGR may suggest strong historical growth, but it doesn’t guarantee future results and may come with more risk.
Your personal goals and risk tolerance also play a key role. A steady 5–7% CAGR might be reasonable for long-term investors, but context matters.
You may think of CAGR as one tool—not the only one—to understand how investments have performed over time.
Conclusion
Understanding CAGR may equip you with a valuable tool for evaluating investment performance and comparing different opportunities on equal footing. While it may simplify complex data into an easy-to-understand percentage figure, remember that it’s just one piece of the puzzle when assessing financial decisions.
As an investor in today’s dynamic markets, metrics like CAGR and other tools may help you build a more comprehensive view of your portfolio’s performance.
You may approach financial metrics cautiously and consider consulting with financial professionals before making investment decisions!
Sign up on the Public App today to learn more and take the first step toward investing. With Public, you can build your multi-asset portfolio with the tools, data, and insights you need to make informed investment decisions.