For many US investors, the idea of swing trading sparks curiosity. It’s not quite day trading, where you’re glued to the screen, nor is it the traditional long-term investing approach. It sits somewhere in between—a strategy that plays on short-term price movements but still allows traders to step away.
Why does this matter? The US markets are known for their volatility, with stocks, ETFs, and even crypto experiencing frequent ups and downs. Some investors see this as noise; others see it as an opportunity. Swing trading is essentially about reading that rhythm—understanding when to enter and exit positions without holding on for years or making split-second decisions.
But is it for everyone? That’s the real question. Some investors appreciate the active nature of swing trading, while others prefer the steadiness of long-term growth. Either way, let’s go deeper to understand the concept of swing trading, how it works, strategies, and more.
Swing trading is a short- to medium-term strategy. Unlike day trading, it allows traders to hold positions for days or weeks.
Technical analysis plays a key role – Indicators like moving averages, RSI, and MACD may help identify trade setups.
Risk management is crucial – Setting stop-loss levels and position sizing may help manage potential losses.
Market conditions impact profitability – Volatility, trends, and sector performance may influence trade success.
What is swing trading?
Swing trading involves identifying and capitalizing on short- to medium-term price movements. Unlike day trading, where trades are closed before the market closes, swing trading allows positions to be held for multiple days or weeks.
It operates on the idea that financial markets move in cycles, with prices swinging between upward and downward momentum periods.
Rather than making rapid, intraday decisions or holding investments for years, swing traders analyze market patterns to identify potential entry and exit points within these cycles. This approach is used across various asset classes, including stocks, ETFs, and commodities, and is shaped by factors such as market trends, investor sentiment, and economic conditions.
How does swing trading work? A hypothetical trade example in Stock XYZ Corp
Swing trading works by taking advantage of short- to medium-term price movements in financial markets. It involves identifying trends, entering positions based on expected price swings, managing risks, and exiting at an optimal point.
Unlike day trading, where trades are completed within a single day, swing trading spans multiple days or weeks, depending on market conditions.
Imagine you are analyzing a stock, XYZ Corp, which has been trading between $50 and $60 over the past few months. You notice that every time the price drops near $52, it tends to rise back toward $58–$60 within a couple of weeks.
Here’s how the process typically unfolds:
1. Identifying trade setups
You review the stock’s price chart and observe:
Support level at $52 – The stock has bounced off this price multiple times.
Resistance level at $60 – The stock struggles to go higher than this.
Moving averages confirming the trend – The 50-day moving average suggests an upward trend.
Based on this pattern, you consider entering a trade when the stock is near $53, anticipating a move toward $58–$60.
Summary: Before entering a trade, you look for potential opportunities by analyzing price charts, trends, and historical patterns. Technical indicators, such as moving averages, trendlines, and support and resistance levels, may help spot setups where price movements are likely to occur. The goal may be to identify an entry point that aligns with the expected market movement.
2. Executing the trade
You decide to enter a trade when XYZ’s stock is at $53. To manage risk, you set:
Stop-loss at $50 – If the price drops below this level, you exit to limit potential loss.
Target exit at $59 – Slightly below the resistance level to secure profits before a possible pullback.
Summary: Once a trade setup meets your criteria, you enter a position by buying or selling an asset. If you anticipate a price increase, you take a long position; if you expect a decline, you take a short position. The timing of execution depends on market conditions, liquidity, and confirmation signals from technical indicators.
3. Managing the trade
Over the next few days, you monitor the stock’s movement:
The stock price moves up to $55 – Your trade is heading in the expected direction.
A market update pushes the price to $57 – You decide to adjust your stop-loss to $54 to protect some of the gains.
A minor pullback occurs, but the price remains above your adjusted stop-loss.
Summary: After entering a trade, you monitor its progress while keeping risk in check. This involves tracking price movements, market trends, and external factors that might impact the asset. Some traders set predefined exit levels or use stop-loss and take-profit points to manage potential losses and lock in gains.
4. Closing the trade
After a few more days, XYZ reaches $59, your target price. You decide to exit the trade by selling your position, securing a $6 per share gain.
If the price had moved in the opposite direction and hit $50, your stop-loss would have automatically closed the trade, limiting your loss to $3 per share.
Summary: A trade is closed when the price reaches a target level, market conditions change, or a predetermined exit strategy is triggered. This could mean selling a long position or buying back a short position. The outcome of the trade—whether a gain or a loss—depends on how the market moves relative to your expectations.
Different swing trading strategies you should consider
There is no single approach to swing trading—different strategies help traders navigate various market conditions. Here are some of the most common swing trading strategies:
1. Trend following strategy
Trend trading focuses on identifying the overall direction of a stock or market—upward or downward—and aligning with that movement. Traders using this approach may study patterns like higher highs or lower lows and use tools like moving averages to interpret trend strength.
2. Pullback trading strategy
Pullback trading centers on identifying temporary price drops within an existing uptrend or brief rallies within a downtrend. The idea is to observe whether the move is part of a normal price fluctuation or a sign of reversal. Tools like moving averages or Fibonacci retracements may help assess potential re-entry points.
3. Reversal trading strategy
In reversal trading, the focus is on spotting when a current trend may be losing steam. Traders watch for signals of a trend change—such as double tops or bottoms, candlestick patterns, or shifts in momentum indicators—to anticipate a potential direction change.
4. Breakout trading strategy
Breakout trading involves monitoring price levels where an asset has historically struggled to move beyond (resistance) or fallen below (support). When the price moves past those levels, some traders consider it a signal that momentum may carry the price further. Volume and volatility are often used to assess breakout strength.
5. Momentum trading strategy
Momentum trading involves observing assets that appear to be moving strongly in one direction over a short period, often accompanied by higher-than-average trading volume.
This approach may include reviewing factors like recent earnings announcements or broader sector movements to understand price changes. Traders typically use momentum indicators to study whether the trend has potential to continue, though such patterns do not guarantee any specific outcomes.
6. Moving average crossover strategy
This strategy involves analyzing two different moving averages—often a short-term and a long-term one. A crossover, where the short-term average intersects the long-term average, may be viewed by some traders as a possible shift in market momentum.
While this can be one way to study trend direction, it should be interpreted as part of a broader analysis rather than a predictive signal.
7. Range trading strategy
Range trading involves monitoring price behavior between two levels: support (a perceived lower boundary) and resistance (a perceived upper boundary). When prices fluctuate within this range, some traders look for signs of consistency or potential breakout.
Indicators like volume or oscillators may be used to study price stability within the range, but outcomes can vary depending on market dynamics.
Each of these strategies relies on disciplined analysis, not speculation. Market conditions can shift rapidly, so no strategy guarantees success. Rather than predicting outcomes, swing traders typically use historical patterns, indicators, and defined rules to guide their decisions.
Best indicators for swing trading
Swing traders rely on technical indicators to analyze price trends, momentum, and potential reversal points. Below are some of the most commonly used indicators in swing trading:
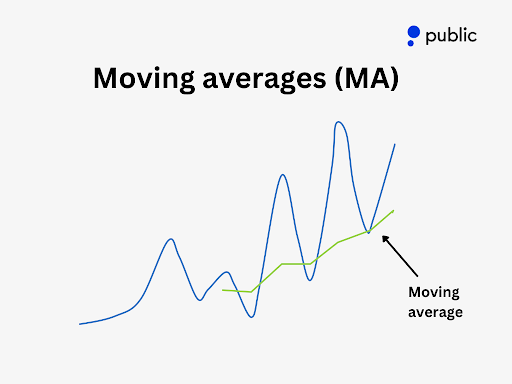
1. Moving averages (MA)
Moving averages may help smooth out price data to identify trends over a specific period. The two most common types are:
Simple moving average (SMA): Calculates the average price over a set period (e.g., 50-day or 200-day SMA).
Exponential moving average (EMA): Gives more weight to recent prices, making it more responsive to price changes.
Use case: You might use the 50-day and 200-day moving averages to confirm an uptrend or downtrend before entering a trade.
Example: If a stock price consistently stays above its 50-day moving average, it may indicate a strong uptrend.
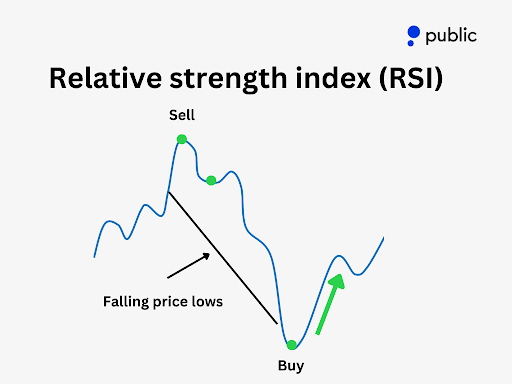
2. Relative strength index (RSI)
RSI is a momentum oscillator that measures the speed and change of price movements on a scale of 0 to 100, helping identify overbought or oversold conditions.
Above 70: The stock may be overbought and could experience a pullback.
Below 30: The stock may be oversold and could be due for a rebound.
Use case: RSI can help you decide whether a stock is too risky to buy or if it might be a good time to enter a trade.
Example: If a stock’s RSI is at 75, it might indicate that the stock is overbought, and you may wait for a pullback before entering.
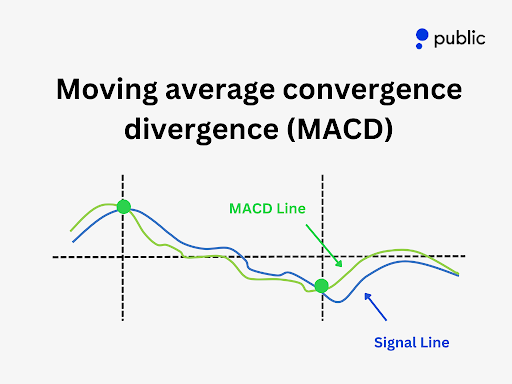
3. Moving average convergence divergence (MACD)
MACD helps identify changes in a trend by comparing two moving averages.
MACD line & signal line: A crossover between the two lines may indicate a buy or sell signal.
Histogram: This shows the strength of momentum; larger bars mean stronger trends.
Use case: You may use MACD crossovers to spot potential trend reversals before making a trade.
Example: If the MACD line crosses above the signal line, it may indicate a bullish trend, while a downward crossover may signal a bearish trend.
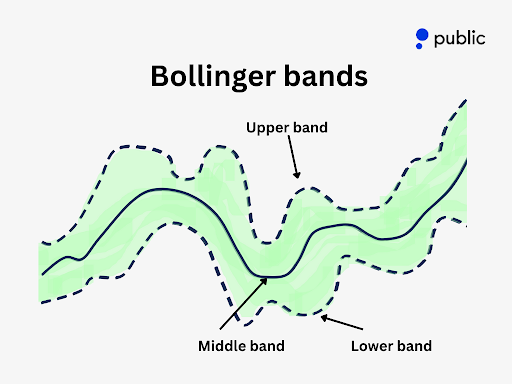
4. Bollinger bands
Bollinger Bands consist of three lines: a middle moving average and two outer bands that expand or contract based on price volatility.
Wide bands: High volatility, potential for large price swings.
Narrow bands: Low volatility, potential of an upcoming breakout.
Use case: Bollinger Bands may help you identify price breakouts or reversals.
Example: If a stock price touches the lower band and starts moving up, it might indicate a potential buy opportunity.
5. Fibonacci retracement
Fibonacci retracement levels help identify potential support and resistance levels based on historical price movements.
Common retracement levels: 23.6%, 38.2%, 50%, 61.8%, and 78.6%
Use case: You can use Fibonacci retracement levels to determine where a stock might reverse after a pullback.
Example: If a stock in an uptrend pulls back to the 61.8% retracement level and then bounces, it may suggest a continuation of the trend.
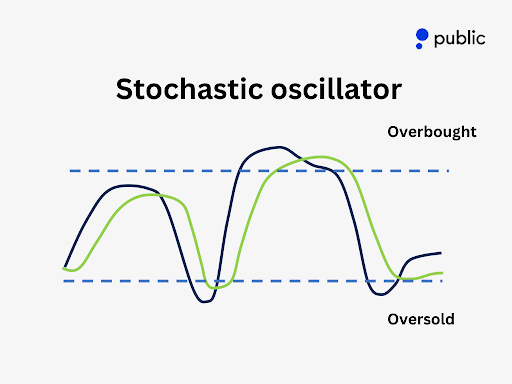
6. Stochastic oscillator
The stochastic oscillator measures momentum and compares a stock’s closing price to its price range over a specific period.
Above 80: The stock is considered overbought.
Below 20: The stock is considered oversold.
Use case: You can use it to spot potential reversals when the oscillator crosses these levels.
Example: If the stochastic oscillator moves below 20 and starts turning upward, it may indicate a buying opportunity.
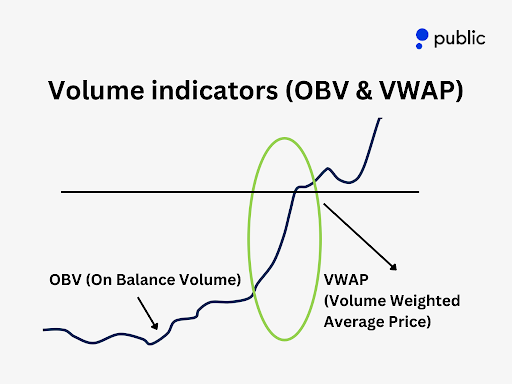
7. Volume indicators (OBV & VWAP)
Volume indicators may help confirm the strength of price movements by analyzing buying and selling activity.
On-balance volume (OBV): Tracks cumulative volume to confirm trends.
Volume weighted average price (VWAP): It may help determine a stock’s fair price by averaging price and volume over a trading session.
Use case: High volume during a breakout may suggest a strong move, while low volume could indicate a false breakout.
Example: If a stock breaks above resistance with high OBV, it may indicate strong buying interest and potential for further upside.
Swing trading vs. Day trading vs. Investing
When participating in financial markets, you have different approaches to managing your trades and investments. Swing trading, day trading, and investing each have distinct characteristics, timelines, and objectives.
Understanding these differences can help you determine which approach might align with your financial goals and risk tolerance.
Feature
Swing Trading
Day Trading
Long-Term Investing
Holding Period
Days to weeks
Intraday (minutes to hours)
Years to decades
Strategy Focus
Short-term price swings
Rapid trades within a day
Long-term growth
Potential Risk Level
Moderate
High
Lower (depending on assets)
Time Commitment
Moderate
High (full-time)
Low
Technical Analysis Usage
Heavy
Essential
Limited
Key considerations before you start swing trading
1. Understanding market conditions
The market environment plays a significant role in swing trading. Prices move based on various factors, including economic trends, interest rates, corporate earnings, and geopolitical events.
Some market conditions favor swing trading more than others. A trending market, where prices move consistently in one direction, may offer clearer trade opportunities.
In volatile markets, price swings may be sharper, creating both opportunities and risks.
During periods of low market activity, price movements might be limited, making it harder to find profitable trades.
Consider this: If the overall market is in a strong uptrend, swing traders might focus on buying opportunities. In a choppy or sideways market, trades may require shorter holding periods.
2. Managing risk
Risk management is essential in swing trading, as price fluctuations may go both in your favor and against you. Unlike investing, where long-term growth may balance out short-term losses, swing trading involves shorter time frames, making risk management even more critical.
Setting stop-loss levels helps limit potential losses if a trade moves in an unexpected direction.
Determining your position size ensures that no single trade risks too much of your capital.
Maintaining a risk-to-reward ratio helps assess whether a trade is worth taking based on potential profit compared to potential loss.
Example: If you risk $100 on a trade with a potential reward of $300, you have a risk-to-reward ratio of 1:3. This means even if not all trades are successful, overall gains may outweigh losses.
3. Choosing the right stocks
Not all stocks move in a way that suits swing trading. Some stocks exhibit more predictable price swings, while others may be too stable or erratic.
Stocks with higher trading volume may tend to have smoother price movements and better liquidity, which might make it easier to enter and exit trades.
Stocks that show clear price trends may be more suitable for swing trading than those with unpredictable movements.
Sector trends can also influence stock behavior—if a particular industry is performing well, stocks within that sector might offer better trading opportunities.
Consider this: A stock that frequently moves 5-10% in a few days might provide more trading opportunities than a stock that moves less than 1% in the same period.
4. Using trading tools
Swing traders rely on tools to analyze price movements and make informed decisions. Technical indicators, chart patterns, and trading platforms all may play a role in the process.
Technical analysis tools like moving averages, RSI, and MACD may help identify trade setups.
Chart patterns such as trendlines, support, and resistance levels may help traders spot potential entry and exit points.
Trading platforms like Public.com provide access to real-time market data, charting tools, and execution options for placing trades efficiently.
Example: If a stock is approaching a historically strong support level, technical indicators may help confirm whether it’s a good opportunity to enter a trade.
Conclusion
Swing trading is a trading strategy that aims to capture short-term market movements, balancing active trading with longer holding periods than day trading. While it can present opportunities, it requires discipline, risk management, and technical knowledge. If you’re considering swing trading, be sure to assess whether it aligns with your investment goals and risk tolerance. If you’re looking for a platform to start trading stocks, consider signing up with Public.com. With Public, you can trade stocks, bonds, cryptos, options and ETFs while accessing real-time market insights. Join Public today and start building your multi-asset portfolio with the tools, data, and insights you need to make informed investment decisions in all-in-one brokerage platform.